Device Details
The Device Details section provides an in-depth analysis of your device’s data.
Overview
The Device Details section provides a comprehensive view of an asset's data, allowing users to manage device information, update status, and visualize live and historical records. This module is essential for tracking and maintaining device performance, ensuring accurate data representation across the entire application.
Key functionalities include:
- Device Details Drawer: Edit essential device information and update status with predefined states.
- Details Section: View live and historical data with various chart representations.
- Period Selector: Define the data range for visual reports with pre-set and custom options.
- Static and Dynamic Data: Monitor fuel levels, location, and IO-based metrics through interactive graphs and charts.
Module Components
Device Details Drawer
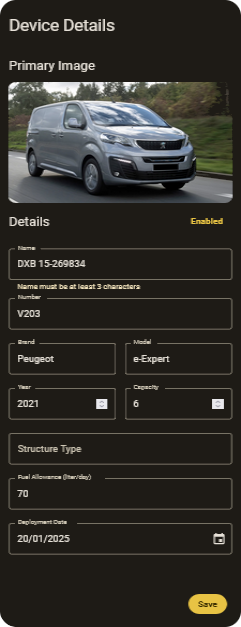
The Device Details Drawer on the left side of the screen displays essential device details. The drawer fields are editable which means that this drawer also allows for updating the device information. If any modifications are made the Save button at the bottom makes it so that any modifications are not applied until the button is clicked. This helps in preventing the application of any undesirable edits or edits made by mistake. The drawer allows for editing the following fields:
- Name: Any unique name to identify the asset. This can be either a plate number, IMEI number, or product serial.
- Asset Number: The asset number can hold the companies generated asset code for the asset.
- Brand: Specify the brand of the asset.
- Model: Enter the model name or number.
- Year: Define the year of production or purchase (based on your preference).
- Capacity: This field can be used flexibly. For example, for a bus, enter the number of seats available.
- Fuel Allowance: Set a daily fuel limit for the asset. This is used in the
Statistics Moduleand may be used to generate alerts in theAlerts Module. - Deployment Date: Record the asset’s deployment or activation date.
The information entered in this module for the device is used across the entire application and in all modules.
Note: The Device Details Drawer is a static component which means it will show in all tabs/sections/sub-pages including the Documents and Settings sections and the operation is the same across all of the sections.
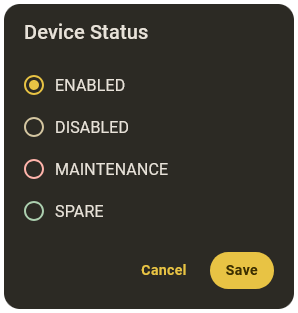
In addition to allowing for modyfing the device info, the Device Details Drawer allows for updating the device status. A text button right below the device image allows to do just that. Once clicked the dialog with supported status properties will be shown to select from. Available properties include:
- ENABLED: This status type indicates that the vehicle/asset is ready for daily operations.
- DISABLED: This status type indicates that the vehicle/asset has nothing wrong with it but should not be used for any reason.
- MAINTENANCE: This status type indicates that the vehicle/asset has been sent for maintenance.
- SPARE: This status type indicates that the vehicle/asset is stored as a spare unit and should not be used without permission and changing the status.
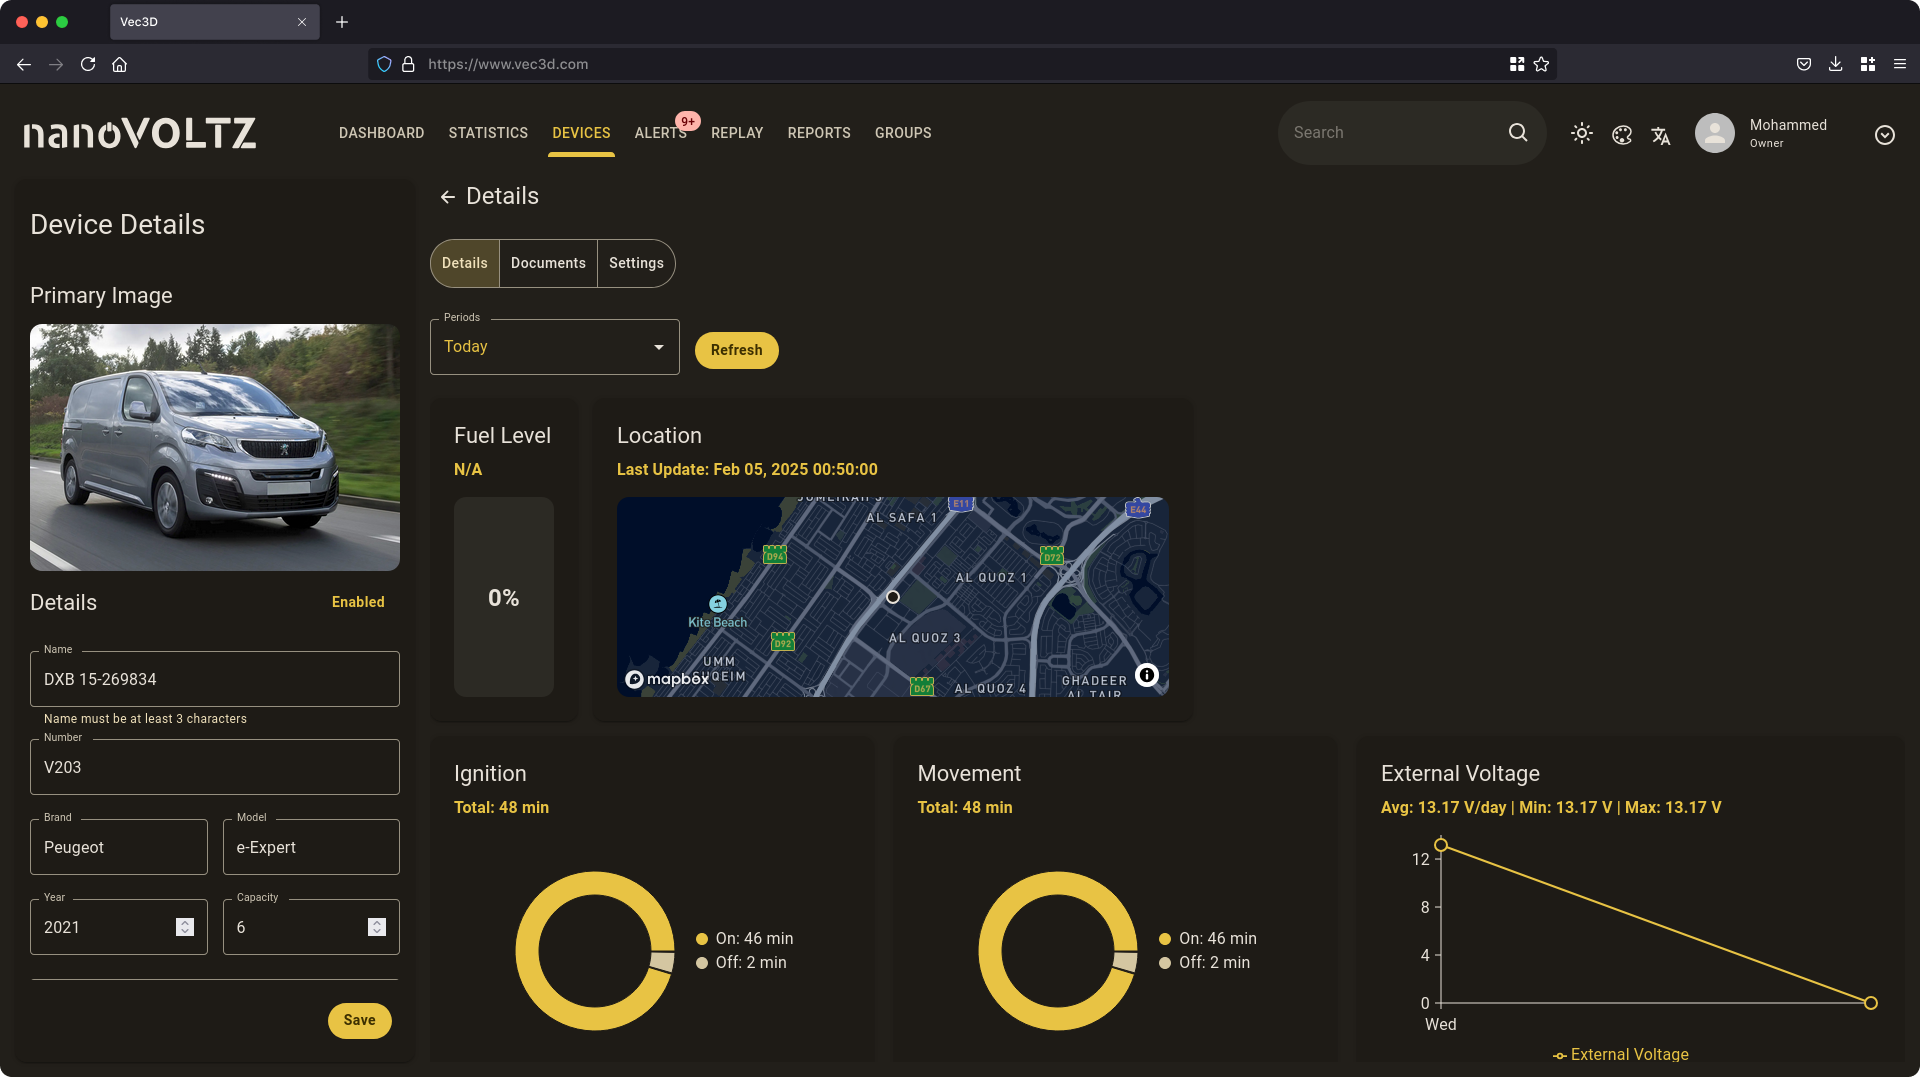
Details Section
The details section shows live and historical data received by the device in the form of records, The data is visualized using different types of charts to make data easy to understand.
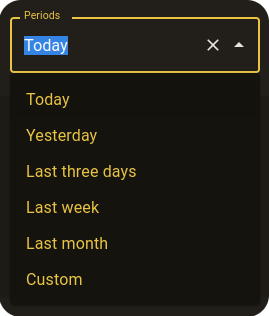
The first component to be observed in this section is the period selector. This selector allows for selecting the period which will determine the date range of data used to construct the charts and graphs available in this section. The selector provides a set of predifined options in addition to the possiblity of selecting a custom date range. Currently, the pre-defined options include:
- Today: Show reports the current day.
- Yesterday: Show reports for the previous day.
- Last three days: Show all reports available for the last 3 days.
- Last week: Show all reports available for the last week.
- Last month: Show all reports available for the last month.
- Custom: Selecting this will promt you to enter a custom date range for the reports.
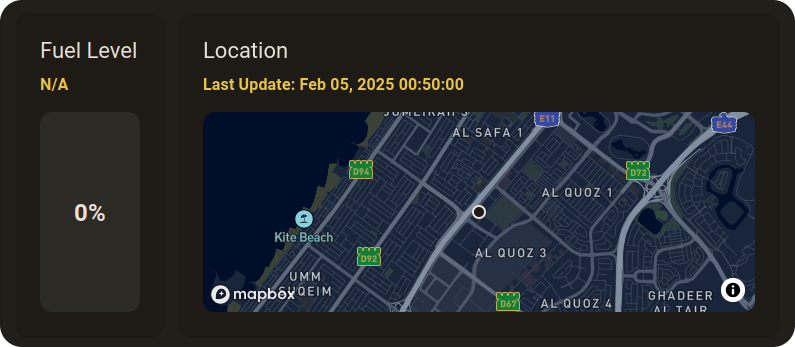
The first two cards in this section are static and are not affected by the period selected. These two cards are meant to show the latest live data for both the fuel level and the last known location for the device. The current fuel tank level for the asset is shown in the Fuel Level card accompanied with the source which the reading was sourced from. The location card shows the last known location of the device on the map, provided with the last fix-time taken from the record. This can be perticularly useful in-case the connection with the device is permenantly lost for any reason.
Note: If the device being used doesn't support reading the fuel level from sources like OBD or CAN-Bus, for example Teltonika FMC130, then the level will show as 0% and the source will display N/A.
Below the static cards directly, the dynamic data sub-section begins. The data displayed here is dynamically generated based on the IO options enabled in the Device Settings Section in the same module. Any enabled IO setting will be used to generate a graph/chart of the appropriate type.
Note: If a IO is enabled in the Device Settings Section for an IO that the device doesn't support or for an IO that is not physically connected to an input then the charts will not display any data at all but the chart/graph will be displayed. Expected values may include 0, null, or undefined.
Chart types in this sub-section include:
- Line Charts: Used to represent analog value data.
- Pie Charts: Used to represent digital value data.
- ASCII/Text Charts: Used to represent text value data, such as driver ID etc...
Below are some examples for different chart types and the expected data to be displayed in them:
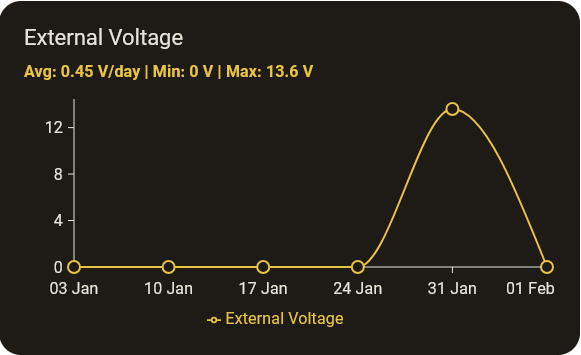
- Line Chart (Analog Data Preview): These charts represent continuous data trends over time. The time intervals are adjusted dynamically based on the selected period:
- Less than a week → Data is grouped by days.
- Less than a month → Data is grouped by weeks.
- Less than a year → Data is grouped by months.
- More than a year → Data is grouped by years.
Example, External voltage over time:
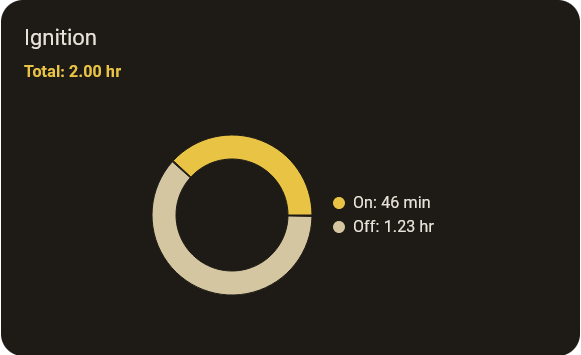
- Pie Chart (Digital Data Preview): These charts show binary data (On/Off states), representing how long a particular input was active or inactive.
Example, Engine runtime vs. idle time:
- ASCII/Text Chart (Text-Based Data): String cards present summarized data in a list format, where each row includes:
- A description: could be driver ID or any other text based reading.
- The number of occurrences: within the selected period.
Example, Driver ID:
Displays how many times a specific ID card has been used to activate a device. Multiple ID's listed each with the number of activations in a list inside the card.
Key Features Recap
- How to modify device information and details.
- How to update a device's status.
- How to preview live/historical IO data for an individual device.